Ethereum Pops Higher As The S&P 500 Attempts To Rebound: What’s Going On?

Ethereum (CRYPTO: ETH) surged up over 5% at one point during Tuesday’s 24-hour trading session, attempting to regain the eight-day exponential moving average as support.
The move higher came in tandem with the S&P 500, which rebounded slightly to trade up 0.56% before retracing to mostly flat.
A bounce across major indices and the crypto sector was the most likely scenario because of the big bearish price action that has dominated the stock market since Tuesday, Dec. 13.
See Also: Trump's NFT Collection Accused Of Using Photoshopped Stock Images
While the S&P 500 was rebounding on below average volume, Ethereum was seeing a high level of volume, which suggests the bulls may be attempting to win back control.
Volume is the total number of shares, coins or tokens traded in a security within a specific period of time. It’s a momentum indicator used by technical traders to gage overall interest and sentiment in a stock. Volume is also used as an indicator to confirm a trend or trend change.
When bullish trading volume increases, the share price of the stock usually moves higher whereas increasing bearish volume, when a stock is in a downtrend, usually pushes the price lower. In contrast, lower than average trading volume usually indicates consolidation which results in the stock trading sideways.
- When a bullish trader has a position in a security, decreasing volume can act as sell signal because it indicates the stock is running out of buyers. When increasing volume eventually comes in to break the stock out of the sideways range, bullish traders may choose to enter a position if the stock begins to move upwards.
- A bearish trader in a short position may watch for decreasing bearish volume to indicate the stock is running out of sellers and a reversal may be in the cards. If big bearish volume eventually picks up and breaks the stock down from a consolidation pattern, bearish traders may choose to enter into a short position.
Want direct analysis? Find me in the BZ Pro lounge! Click here for a free trial.
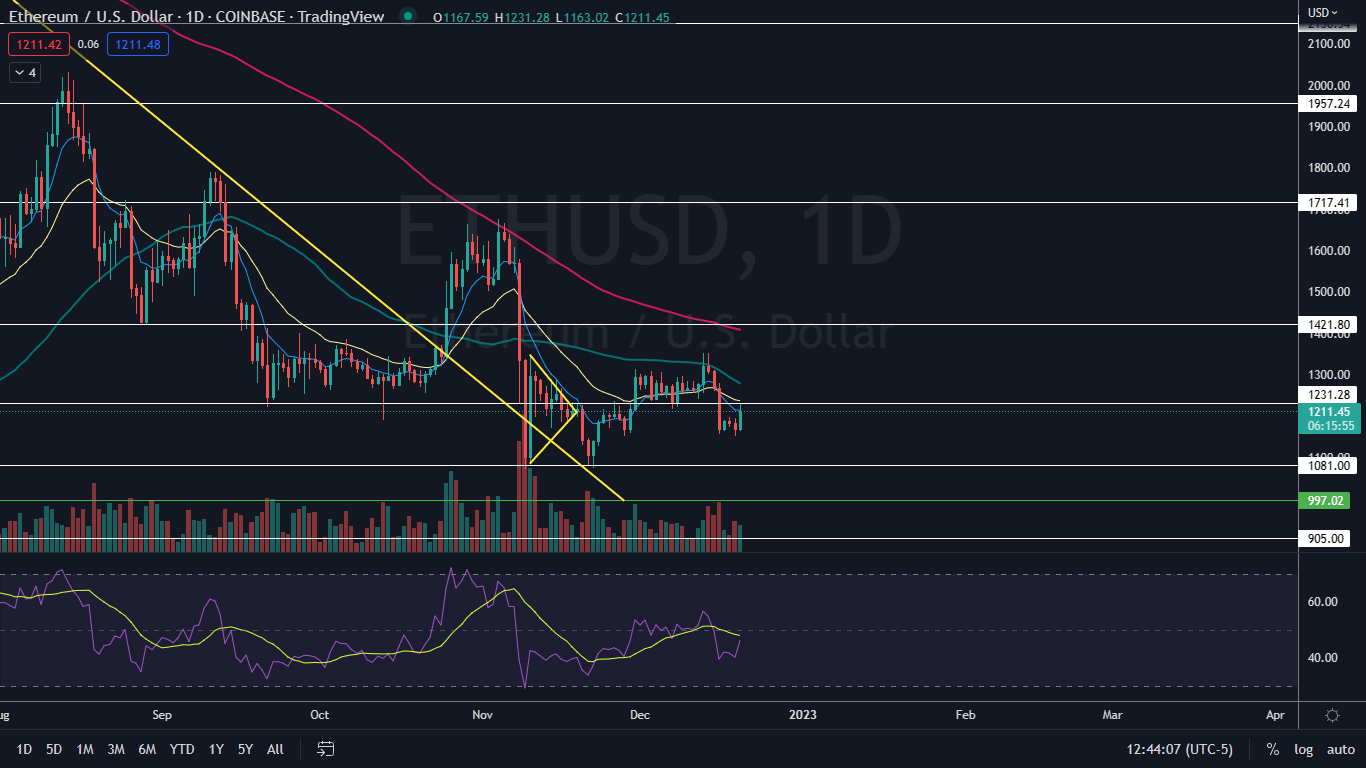
The Ethereum Chart: By 12 p.m. on Tuesday, Ethereum’s volume was measuring in at about 272,000 on Coinbase, compared to the 10-day average of 282,663. By 7 p.m., when the 24-hour trading period ends, Ethereum’s volume will be higher-than-average, which indicates the crypto may be gaining interest from the bulls.
- The move higher also caused Ethereum to negate a possible bear flag that had developed between Dec. 14 and Monday. When creating the bear flag, however, Ethereum negated its uptrend, which is potentially bearish.
- If Ethereum closes the trading day near its high-of-day price, the crypto will print a bullish Marubozu candlestick, which could indicate higher prices are in the cards for Wednesday. If Ethereum closes the trading day with a substantial upper wick, it could indicate the crypto will trade lower, which could confirm a new downtrend.
- Ethereum has resistance above at $1,231.28 and $1,421.80 and support below at $1,081 and $905.


