Bitcoin ETF Hype Fades As IBIT Slumps Below Key Averages — Did Investors ‘Bet On The Wrong Horse’?
The iShares Bitcoin Trust ETF (NASDAQ:IBIT) is struggling to maintain momentum after a strong start to 2024. While the ETF is up 22.08% year-to-date, it’s down a troubling 20.94% over the last six months.
After an initial surge following its Jan. 11 debut, IBIT has slipped, leaving investors wondering whether the hype around Bitcoin ETFs is fading.
Famed Bitcoin (CRYPTO: BTC) critic Peter Schiff hasn’t missed the opportunity to weigh in. In a recent post, he pointed out that Bitcoin ETFs, including IBIT, have underperformed, gaining less than 17% since launch.
In contrast, gold ETFs, like SPDR Gold Trust (NYSE:GLD), have surged 24% despite losing investor interest. Schiff jabbed at Bitcoin investors, suggesting they “bet on the wrong horse.”
Yet, not everyone is so bearish. Matt Hougan, CIO of Bitwise Asset Management, sees Bitcoin ETFs as a historic success, with investment advisors adopting them at record rates.
The catch? These impressive flows are being overshadowed by even larger investments elsewhere, muting the overall impact.
IBIT Facing Strong Bearish Signals
From a technical perspective, things look grim for IBIT. The ETF is trading below its five, 20 and 50-day exponential moving averages, signaling a strong bearish trend.
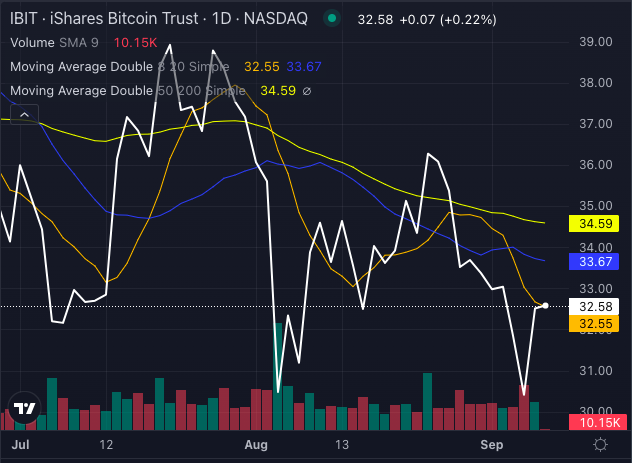
Chart created using Benzinga Pro
With the current price at $32.58, in sync with its eight-day SMA at $32.55, and trading lower than the 20-day SMA of $33.67, and the 50-day SMA of $34.59, the charts are flashing warning signs.
Additional indicators aren’t doing IBIT any favors either.
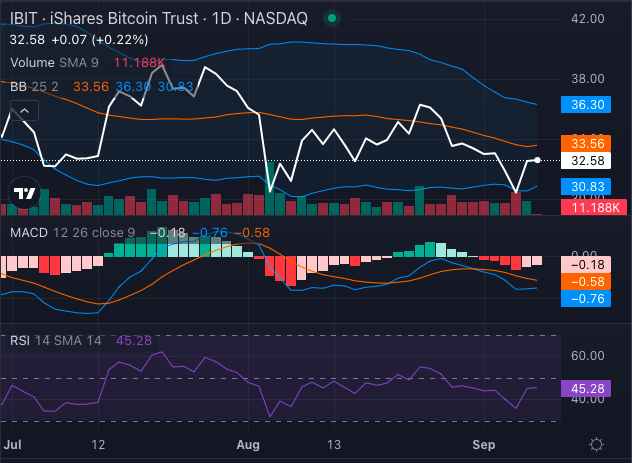
Chart created using Benzinga Pro
The MACD (Moving Average Convergence/Divergence) stands at a negative 0.76, signaling further downward momentum, while the RSI (Relative Strength Index) of 45.28 suggests the ETF is neutral, so not quite at bounce-back territory.
Bollinger Bands indicate IBIT is hovering in the lower band of its range, cementing its bearish signal in the short term.
As Bitcoin ETFs face increasing scrutiny, IBIT investors may need to prepare for more turbulence ahead.
Will it bounce back, or has Schiff’s “wrong horse” prophecy already begun to take shape?
Read Next:
Photo: Shutterstock