Bitcoin’s Golden Cross, Ethereum’s And Dogecoin’s Bellwether Indicator: A Look At Cryptos Into The Weekend

Bitcoin (CRYPTO: BTC), Ethereum (CRYPTO: ETH) and Dogecoin (CRYPTO: DOGE) were trading relatively flat during Friday’s trading session on lower-than-average volume despite the general market surging following the Federal Reserve’s decision Wednesday to hold interest rates steady.
The three popular cryptos have been consolidating since Oct. 24, after Bitcoin, Ethereum and Dogecoin surged on hopes the Security and Exchange Commission is close to approving a spot Bitcoin ETF.
From a technical analysis standpoint, the cryptos have been consolidating near highly important technical levels, with Bitcoin trading under strong resistance at the $36,000 mark and Ethereum and Dogecoin moving horizontally above the 200-day simple moving average (SMA).
The 200-day SMA is an important bellwether. Technical traders and investors consider a stock trading above the level on the daily chart to be in a bull cycle, whereas a stock trading under the 200-day SMA is considered to be in a bear cycle.
The 50-day SMA also plays an important role in technical analysis, especially when paired with the 200-day. When the 50-day SMA crosses below the 200-day SMA, a death cross occurs whereas when the 50-day SMA crosses above the 200-day, a bullish golden cross takes place.
Want direct analysis? Find me in the BZ Pro lounge! Click here for a free trial.
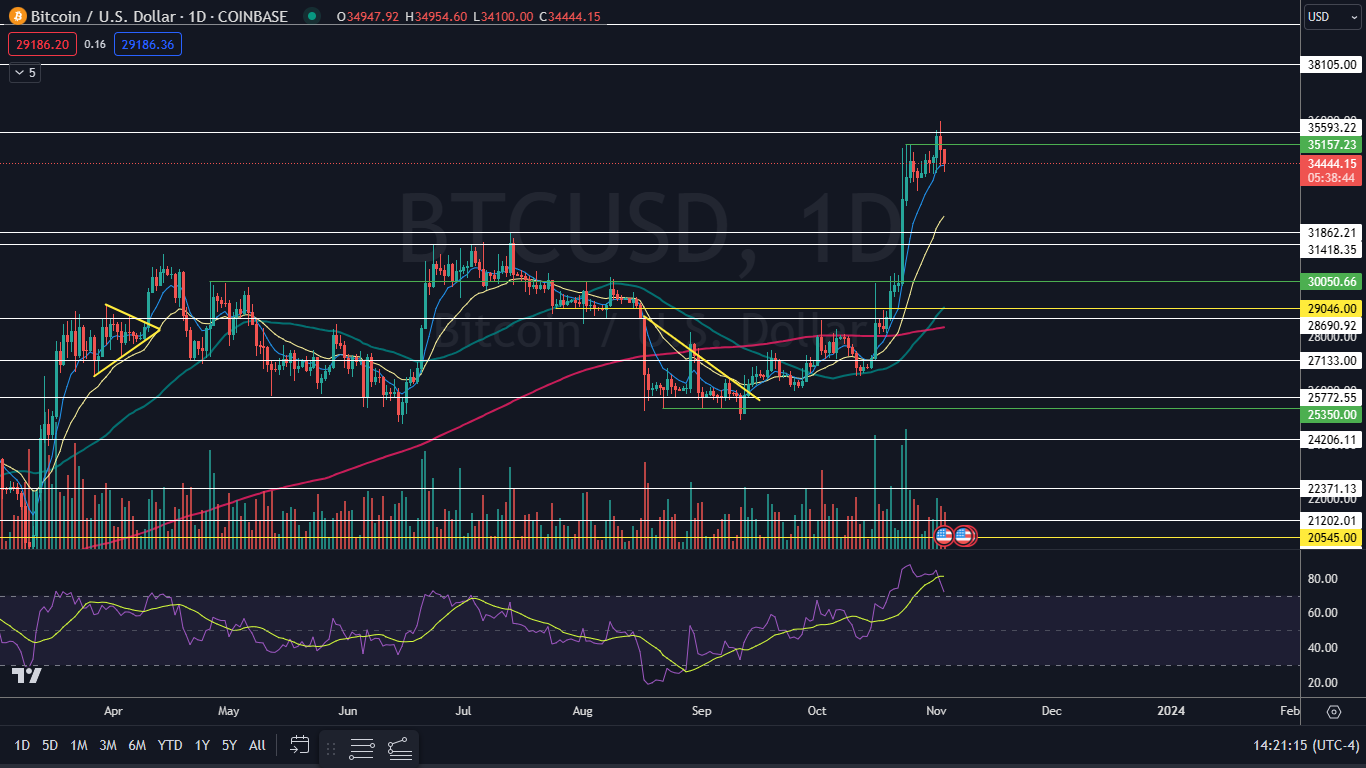
The Bitcoin Chart: Bitcoin has been consolidating sideways on lower-than-average volume, while rejecting the important $36,000 mark on each attempt. The consolidation has been taking place on declining volume, which is often followed by a burst in high volume.
The sideways consolidation is helping to lower Bitcoin’s relative strength index (RSI), which has been trading above the 70% level since Oct. 19. When a stock’s or crypto’s RSI is above 70%, it’s considered to be overbought, which can be a sell signal for technical traders.
Bullish traders want to see Bitcoin’s RSI continue to lower and then for big bearish volume to come in and break the crypto up through $36,000, which could accelerate a move to the upside toward $40,000. Bearish traders want to see big bearish volume come in and break Bitcoin down below the eight-day exponential moving average, which would negate the crypto’s current uptrend.
It should be noted that a golden cross, which occurs when the 50-day SMA crosses above the 200-day, formed on Bitcoin’s chart on Oct. 29, which suggests the crypto is in a strong bull cycle.
Bitcoin has resistance above at $35,593 and at $38,105 and support below at $31,862 and at $31,418.
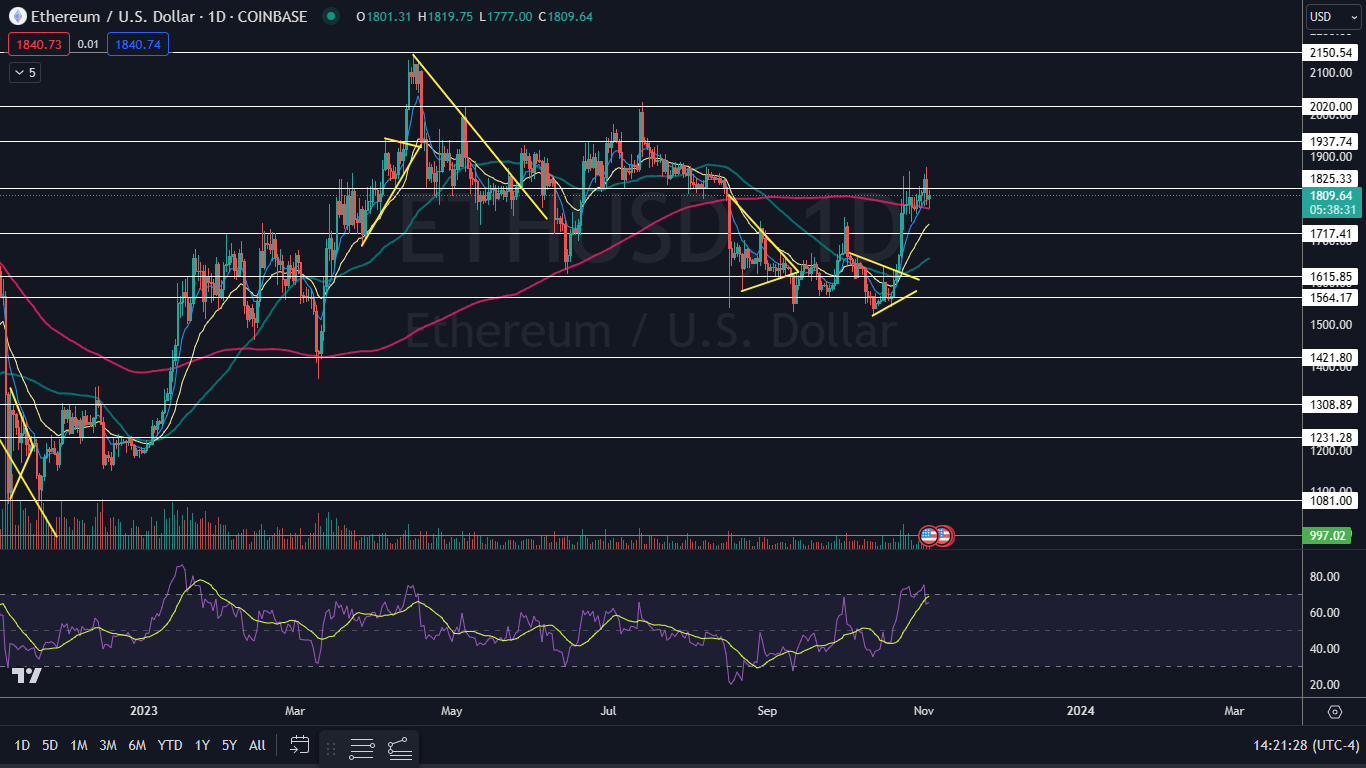
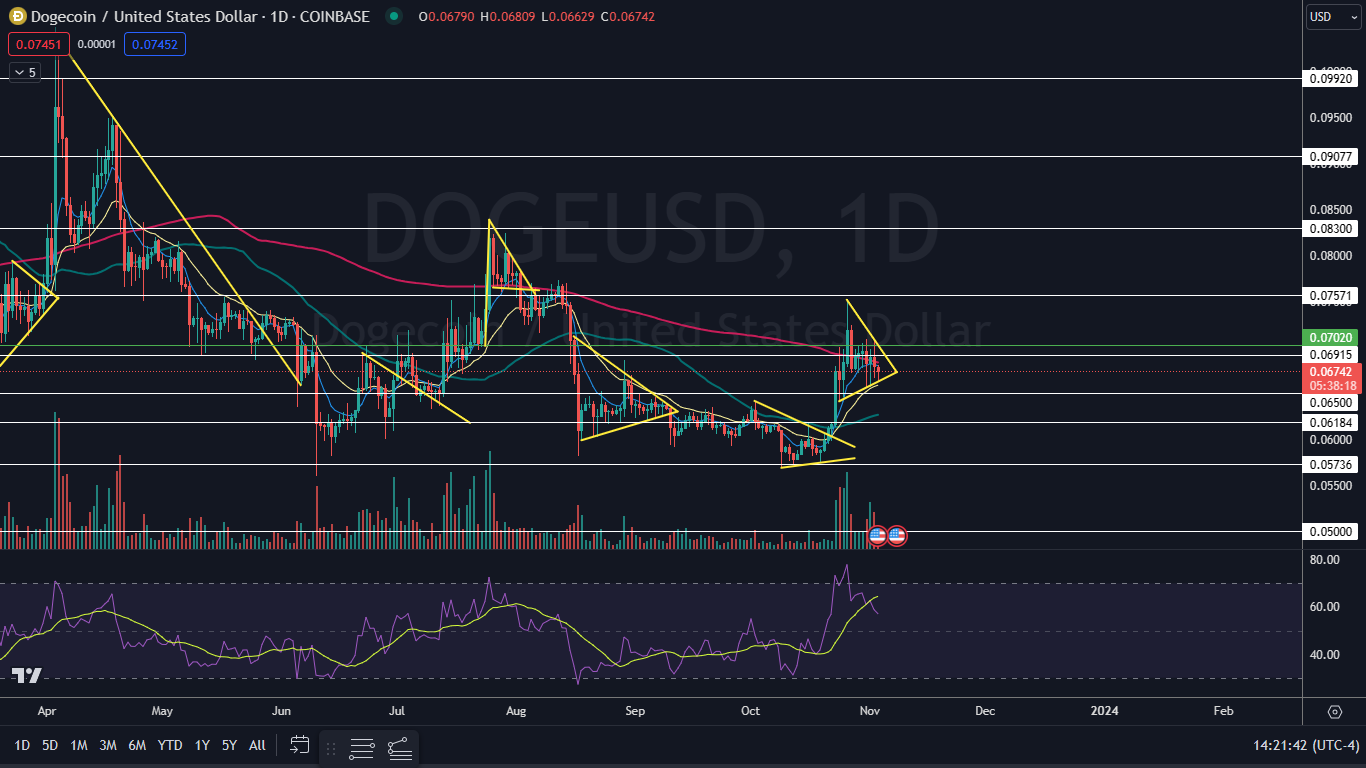
 The Ethereum and Dogecoin Charts: Ethereum and Dogecoin have been consolidating sideways near the 200-day SMA, with Ethereum trading sideways above that area and Dogecoin under it. Both Ethereum and Dogecoin have been consolidating near the 200-day on decreasing volume, which like Bitcoin, indicates a larger move in one direction is on the horizon.
While Ethereum is trading in an uptrend within its consolidating pattern, Dogecoin is trading in a tightening range, forming a triangle formation. If the cryptos break bullishly from their respective patterns, a more powerful move to the upside could be in the cards.
Bearish traders want to see Ethereum break down under the 200-day SMA and for Dogecoin to break down from the lower ascending trendline of the triangle. If either of those two things happens, downside pressure is likely to accelerate.
Ethereum has resistance above at $1,825 and at $1,937 and support below at $1,717 and at $1,615.
 Dogecoin has resistance above at $0.069 and at $0.075 and support below at $0.065 and at $0.061.
 Read Next: