Gold Has A Track Record, But Is Bitcoin About To Prove It’s An Alternative Hedge Against Inflation?

The price of spot gold hit a fresh nine-month high Tuesday, reaching $1,942.51 per ounce before pulling back slightly, in tandem with the general market, which saw high volatility in early trading due to a glitch at the NYSE.
The commodity, widely seen as the best hedge against inflation, has soared almost 20% since Nov. 3, despite inflation beginning to tick lower over the back half of 2022.
Bitcoin (CRYPTO: BTC), which has been argued to be a newer hedge for rising consumer prices, has also risen dramatically since Nov. 21, surging almost 50% since that date.
The Federal Reserve has been walking a tightrope in an attempt to lower inflation, by hiking interest rates, without throwing the U.S. into a recession. In December, the Fed boosted interest rates by a half-point after four consecutive 0.75% rate hikes earlier in the year.
With consumer price index data showing inflation was up 6.5% year-over-year in December, down from 7.1% in November, economists expect the central bank to continue slowing the pace of its hikes.
With the economy slowing, investors may be flocking to gold, and even Bitcoin, for protection in the event of a recession later this year, although the job market remains strong.
Whether or not Bitcoin is a solid hedge against inflation or a full-blown recession can’t be confirmed due to its lack of trading history during severe economic downturns. The last U.S. recession was caused by the collapse of the U.S. housing bubble and lasted from December 2007 to June 2009 — the year Bitcoin first started transacting.
Gold on the other hand, has been traded for centuries and has historically been shown to be a good hedge for inflation and a wise long-term hold during a recession.
Want direct analysis? Find me in the BZ Pro lounge! Click here for a free trial.
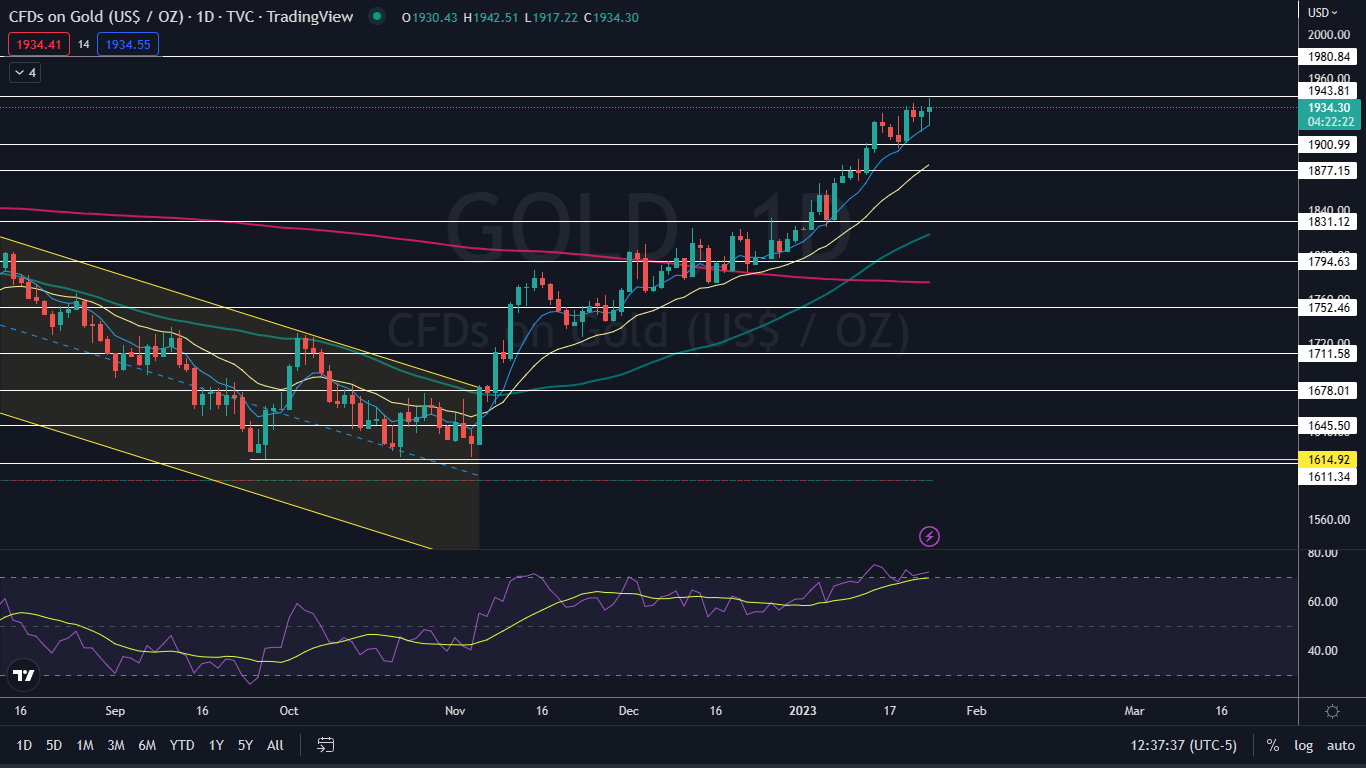
The Spot Gold Chart: Gold is trading in a strong and consistent uptrend, with the most recent higher low formed on Monday at $1,9121.49 and the most recent higher high printed at the $1,937.51 mark on Friday. If gold retraces to the downside on Wednesday, Tuesday’s high-of-day will serve as the next higher high within the uptrend.
If gold closes the trading day near to flat, the commodity will print a doji candlestick, which could indicate the local top has occurred and lower prices are in the cards. If that happens, gold may find support at the eight-day exponential moving average (EMA), which has been guiding the commodity higher since Nov. 4.
Gold has resistance above at $1,943.81 and $1,980.84 and support below at $1,900.99 and $1,877.15.


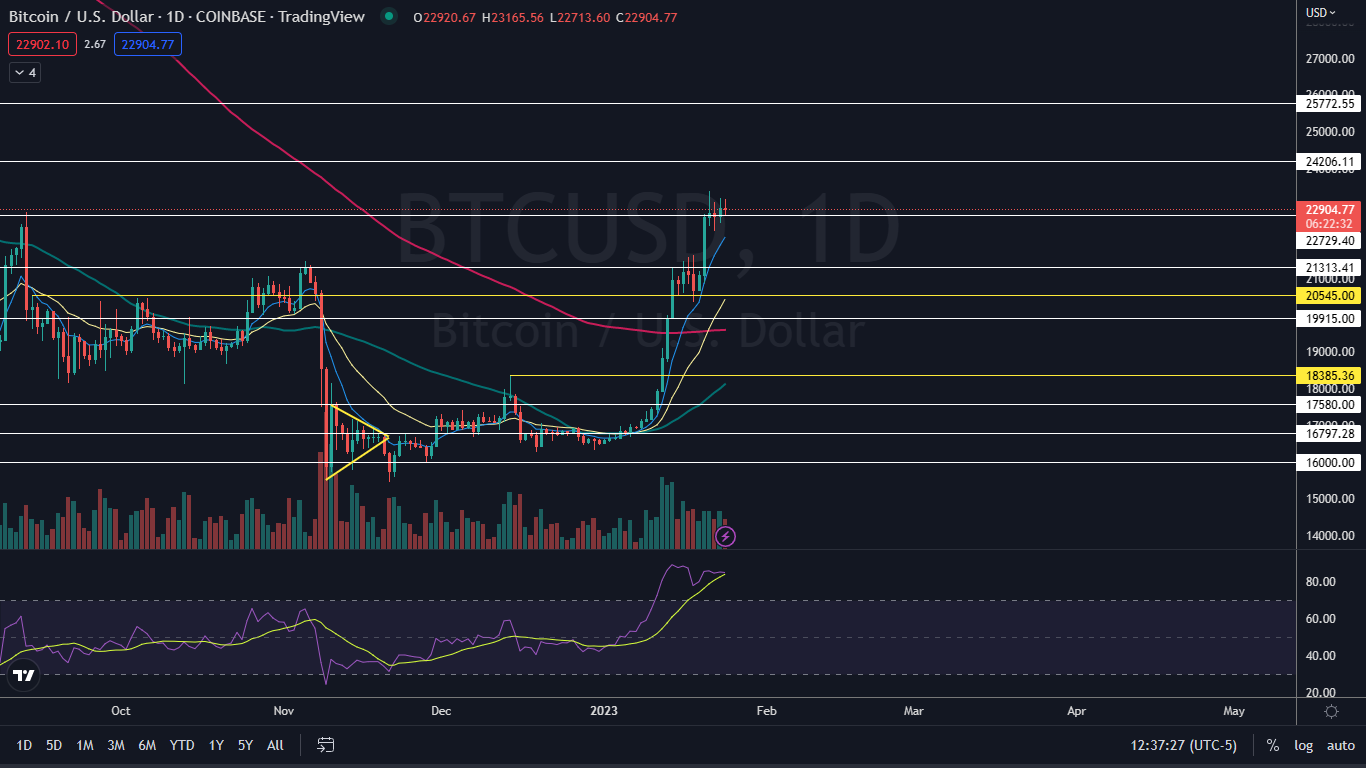
The Bitcoin Chart: Bitcoin was trading in an inside bar pattern during Tuesday’s 24-hour trading session, with all the price action taking place within Monday’s trading range. The crypto has been consolidating mostly sideways since Saturday, after skyrocketing almost 10% between Thursday and Friday.
The sideways consolidation, paired with the surging price, has settled Bitcoin into a possible bull flag pattern on the daily chart. If Bitcoin eventually breaks up bullishly from the flag formation, the measured move indicates the crypto could surge up toward $24,500.
If Bitcoin falls under the eight-day EMA, the bull flag pattern will be negated and the crypto could fall into a downtrend.
Bitcoin has resistance above at $24,206 and $25,772 and support below at $22,729 and $21,313.


Read Next: Bitcoin-Loving Bukele Slams Media As El Salvador Repays $800M Debt
Photo: Ink Drop via Shutterstock


