Shiba Inu Shows Strength Compared To Dogecoin, Settles Into This Pattern: What To Watch For

Shiba Inu (CRYPTO: SHIB) was trading slightly lower during Monday’s 24-hour trading session but showing strength in comparison to Dogecoin (CRYPTO: DOGE), which was tumbling over 8% to lose support at the 200-day simple moving average.
Earlier in the session, Shiba Inu popped up about 2.5% but was unable to break above Sunday’s high-of-day due to bearish price action in Bitcoin (CRYPTO: BTC) and Ethereum (CRYPTO: ETH), which were declining in tandem with the S&P 500.
When Shiba Inu started to fall, the crypto remained within Sunday’s trading range, which has set Shiba Inu into an inside bar pattern on the daily chart. An inside bar pattern indicates a period of consolidation and is usually followed by a continuation move in the direction of the current trend.
An inside bar pattern has more validity on larger time frames (four-hour chart or larger). The pattern has a minimum of two candlesticks and consists of a mother bar (the first candlestick in the pattern) followed by one or more subsequent candles. The subsequent candle(s) must be completely inside the range of the mother bar, and each is called an "inside bar."
A double, or triple inside bar can be more powerful than a single inside bar. After the break of an inside bar pattern, traders want to watch for high volume for confirmation the pattern was recognized.
- Bullish traders will want to search for inside bar patterns on stocks that are in an uptrend. Some traders may take a position during the inside bar prior to the break, while other aggressive traders will take a position after the break of the pattern.
- For bearish traders, finding an inside bar pattern on a stock that's in a downtrend will be key. Like bullish traders, bears have two options of where to take a position to play the break of the pattern. For bearish traders, the pattern is invalidated if the stock rises above the highest range of the mother candle.
Want direct analysis? Find me in the BZ Pro lounge! Click here for a free trial.
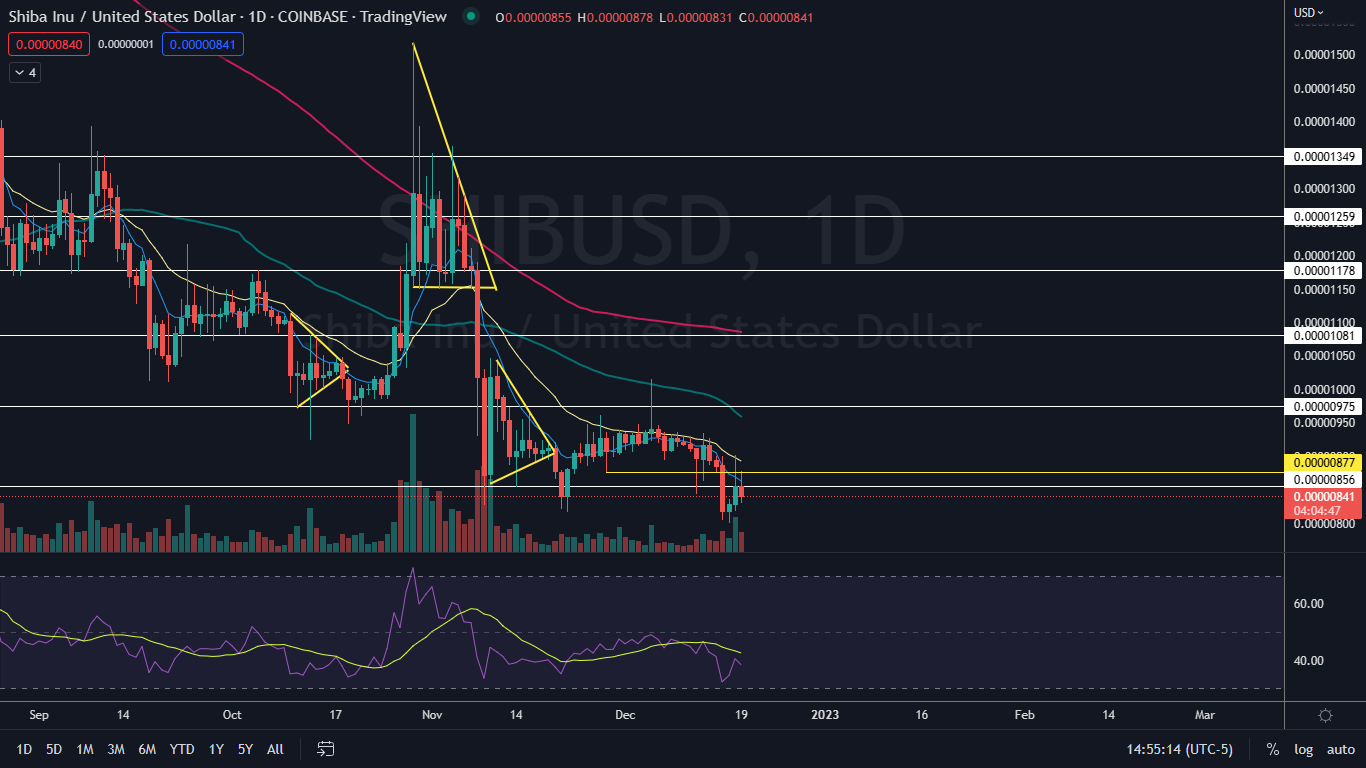
The Shiba Inu Chart: Shiba Inu’s inside bar pattern is neutral because although Shiba was trading higher recently, the overall trend has been lower since Oct. 30. Both bullish and bearish traders can watch for Shiba Inu to break up or down from Sunday’s mother bar on higher-than-average volume later on Monday or on Tuesday to gauge its future direction.
- Shiba Inu is trading in a downtrend, with the most recent lower high formed on Sunday at $0.00000902 and the most recent lower low printed at the $0.000008 mark the day prior. If Shiba Inu breaks down bearishly from the mother bar, the downtrend is likely to continue.
- If Shiba Inu generates the power to break up from the inside bar pattern, a higher high will form, which will negate the downtrend.
- Shiba Inu has resistance above at $0.00000856 and $0.00000957 and support below at $0.00000738 and $0.000006.
Read Next: Dogecoin Misses Out But This Rival Meme Coin Was Among Top 3 Most Popular Cryptos On Binance In 2022